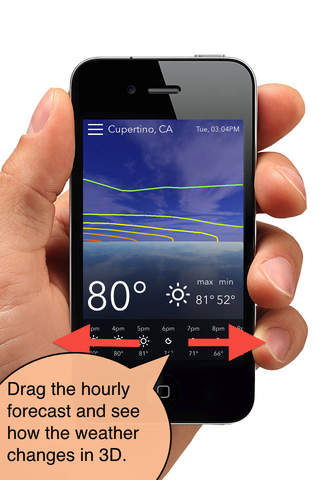
See isobars and rainfall patterns in 3D all around you. Flick through the time bar to see them change over the forecast period.
* Isobars show the air pressure as a series of contour lines. The wind and weather will flow from areas of high pressure to low pressure.
* Hold up your iDevice and see them projected 100kms up into the sky.
* The 6-hour rainfall prediction is also shown projected onto the sky as a heatmap. Areas of high rainfall are shown in red.
* As you flick through the hourly forecast the current conditions for that time are shown. Easily see when it rains, and when its going to stop!
* Search for any location with a natural text query.


